Writing embedded drivers without an MCU
Let me clarify the title up front: there is an MCU. There’s a Raspberry Pi Pico 2 sitting on my desk. What I mean is that the MCU isn’t in my dev loop. I don’t flash it. I don’t reset it. I don’t attach a probe to it. I treat it like a USB peripheral that happens to speak the buses I need — I²C, SPI, UART, GPIOs, ADC, and 1-Wire — and I write all of my driver code as a normal cargo run binary that runs on my laptop, against the real sensor, over a real bus.
This post is about how that works, why it’s nice, and what you can do once your “embedded” driver is just a Rust program with std.
The loop I’m trying to escape
The traditional embedded dev loop looks something like this:
- Edit a line of code.
- Wait for
cargo build --target=thumbv8m.main-none-eabihfto finish. - Reflash the chip (a few seconds with a probe, longer over the bootloader).
- Either power-cycle the board or punch the reset button.
- Squint at
defmtoutput through a probe. - If you need to reproduce a bug, also: physically interact with the board (push a button, breathe on the sensor, jiggle a wire).
- Goto 1.
On a good day with a fast build and a good probe, that’s two minutes per iteration. On a bad day — a stale build cache, a probe that disconnects, a chip in some weird stuck state — it’s five or ten.
The frustrating part isn’t the time. The frustrating part is that none of it is about the driver I’m writing. The driver is just some byte-level logic that talks to a chip over I²C. The chip doesn’t care which CPU is initiating the transactions. The chip certainly doesn’t care that I had to write a linker script and a clock-tree configuration to get there.
So: why not skip all of that, and write the protocol logic somewhere where iteration is free?
Enter Pico de Gallo
Pico de Gallo is a project I’ve been building for exactly this. It’s a small landing board that turns a Pi Pico 2 into a USB-attached protocol bridge. Plug it into your laptop, and your laptop now has an I²C bus, a SPI bus, a UART, a handful of GPIOs, two PWM channels, an ADC, and a 1-Wire master — addressable from any host-side program.
A few things it isn’t, because it gets confused with each of these:
- It’s not a logic analyzer. It drives the bus; it doesn’t sniff somebody else’s.
- It’s not a USB-to-I²C dongle in the FTDI sense. The chip underneath is a Pi Pico 2, the firmware speaks
postcard-rpc, and the host side is a real Rust crate with proper types and async support. - It’s not a debug probe. There’s no SWD on the other end of the cable. There’s only the device you wired up.
What it actually does is let you write this:
use pico_de_gallo_hal::Hal;
use embedded_hal::i2c::I2c;

let hal = Hal::new();
let mut i2c = hal.i2c();

let mut buf = [0u8; 2];
i2c.write_read(0x48, &[0x00], &mut buf).unwrap();
…on your laptop, and have the bytes appear on a real I²C wire, addressed to a real chip, with the reply coming back into buf.
The Pico de Gallo book has the full setup — what to assemble, how to flash the firmware, the pinout, and a tour of each interface. I won’t repeat any of that here. From this point I assume you have a Pico de Gallo plugged in, a TMP108 wired to the I²C connector, and the gallo CLI installed.
Feeling the bus before writing a line of code
The first thing I do with any new chip is poke at it through the CLI. This is the equivalent of the “wiggle a probe at it” step from the hardware world, except it’s three commands.
Did the chip enumerate at the address I think it did?
$ gallo i2c scan
╭────┬────┬────┬────┬────┬────┬────┬────┬────┬────┬────┬────┬────┬────┬────┬────┬────╮
│    │  0 │  1 │  2 │  3 │  4 │  5 │  6 │  7 │  8 │  9 │  a │  b │  c │  d │  e │  f │
├────┼────┼────┼────┼────┼────┼────┼────┼────┼────┼────┼────┼────┼────┼────┼────┼────┤
│ 0  │ RR │ RR │ RR │ RR │ RR │ RR │ RR │ RR │ -- │ -- │ -- │ -- │ -- │ -- │ -- │ -- │
│ 1  │ -- │ -- │ -- │ -- │ -- │ -- │ -- │ -- │ -- │ -- │ -- │ -- │ -- │ -- │ -- │ -- │
│ 2  │ -- │ -- │ -- │ -- │ -- │ -- │ -- │ -- │ -- │ -- │ -- │ -- │ -- │ -- │ -- │ -- │
│ 3  │ -- │ -- │ -- │ -- │ -- │ -- │ -- │ -- │ -- │ -- │ -- │ -- │ -- │ -- │ -- │ -- │
│ 4  │ -- │ -- │ -- │ -- │ -- │ -- │ -- │ -- │ 48 │ -- │ -- │ -- │ -- │ -- │ -- │ -- │
│ 5  │ -- │ -- │ -- │ -- │ -- │ -- │ -- │ -- │ -- │ -- │ -- │ -- │ -- │ -- │ -- │ -- │
│ 6  │ -- │ -- │ -- │ -- │ -- │ -- │ -- │ -- │ -- │ -- │ -- │ -- │ -- │ -- │ -- │ -- │
│ 7  │ -- │ -- │ -- │ -- │ -- │ -- │ -- │ -- │ RR │ RR │ RR │ RR │ RR │ RR │ RR │ RR │
╰────┴────┴────┴────┴────┴────┴────┴────┴────┴────┴────┴────┴────┴────┴────┴────┴────╯
Yes. The TMP108 with its A0 pin to ground sits at 0x48, and there it is. If this had come back empty, I’d know it was wiring, not software, and I’d know it before I’d touched a Rust file.
Can I read its temperature register?
$ gallo i2c write-read --address 0x48 --bytes 0x00 --count 2
0x18 0x40
Two bytes, just as the datasheet promised. Register 0x00 is the temperature register; the top 12 bits of the returned 16 are the signed reading in 0.0625 °C/LSB. So 0x1840 → 0x184 → 388 → 388 × 0.0625 → 24.25 °C. The room I’m in is about 24 °C.
Three commands, no Rust, and I know:
- My wiring works.
- The address I expected is the address the chip enumerated at.
- The data format matches the datasheet.
Those three facts cost me about a minute of reading effort each on a real MCU, every time something goes wrong, because they’re all entangled with everything else. Here they’re isolated and free.
Reading it from Rust
Now for the actual program. The tmp108 crate on crates.io already exists — it’s a regular embedded-hal driver, #[no_std], written for anything that implements embedded_hal::i2c::I2c. Normally you’d pull it into a firmware project, build for a Cortex-M target, and flash. We’re going to pull it into a std binary instead.
[dependencies]
pico-de-gallo-hal = "0.5"
tmp108 = "0.5"
use pico_de_gallo_hal::Hal;
use tmp108::Tmp108;
fn main() -> anyhow::Result<()> {
let hal = Hal::new();
let i2c = hal.i2c();
let mut tmp = Tmp108::new_with_a0_gnd(i2c);
let temperature = tmp.temperature()?;
println!("Temperature: {temperature:.2} °C");
Ok(())
}That’s the whole program. cargo run, and the bytes go out, the reply comes back, and a number prints.
The interesting thing to notice is what isn’t there. The tmp108 crate doesn’t know that pico-de-gallo exists. It has no conditional compilation for “host” or “USB.” Its only requirement is “give me something that implements embedded_hal::i2c::I2c,” and pico-de-gallo-hal does. The exact same Tmp108::new_with_a0_gnd call, with the exact same crate, the exact same version, will run unmodified on an RP2350, an STM32, an nRF52, or any other chip that has an embedded-hal I²C implementation.
This is not emulation. It’s not mocking. It’s not simulation. The bus is real. The chip is real. The driver is real. The only thing that’s different is what’s underneath the I2c trait — and that’s the whole point of the trait existing in the first place.
One honest caveat on that portability claim: of the interfaces Pico de Gallo exposes, only I²C, SPI, GPIO, and Delay have stable, widely-adopted embedded-hal traits today. The TMP108 example above sails through because it’s I²C, and the alert examples in tmp108’s examples/ folder sail through because they only also need GPIO. A driver for, say, a 1-Wire temperature sensor or a UART-attached GPS module won’t be quite as plug-and-play — embedded-hal doesn’t have stable abstractions for those yet, so each crate tends to invent its own. The “unmodified upstream driver” story is strongest for parts whose driver only needs I²C, SPI, GPIO, and timing. For everything else, the host-side loop still works; you just may have to do a bit of shimming.
The dev loop, side by side
Here’s the same edit-and-test cycle from above, redrawn against this program:
- Edit a line of code.
cargo run.
That’s it. A debug build of this program takes under a second to recompile and start. There’s no flash step, no reset, no probe to attach. If the program panics, the stack trace points at the line that panicked, in source, with debug symbols, in the same terminal I just ran it from.
Other things that just work, because it’s std:
cargo testruns against the real chip.cargo benchmeasures real round-trip latency over USB.cargo flamegraphandperfanddtraceand Instruments all work, because it’s a normal native process.println!,dbg!,eprintln!,tracing,env_logger— any of them. Whatever you’d use in a normal Rust program.- The debugger you actually like —
rust-lldb,rust-gdb, the one built into your editor — attaches the way it always does.
The obvious question at this point is what the catch is. We’ll get there.
What having std actually unlocks
The temperature-printing program is the warm-up. The thing that makes this approach worth talking about is what becomes easy next.
Here is a small ratatui dashboard that reads the TMP108 four times a second and plots a live sparkline of the last 60 samples alongside running min / avg / max:
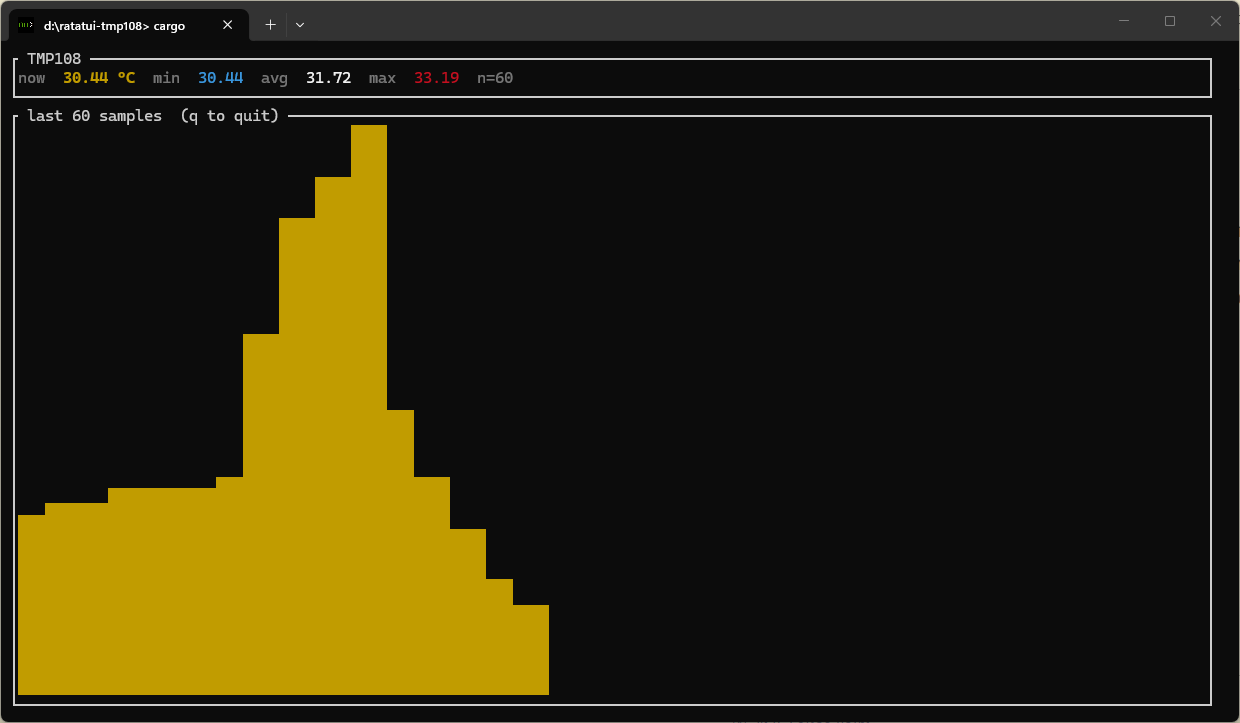
The whole program is about 150 lines and uses three dependencies: pico-de-gallo-hal, tmp108, and ratatui. The interesting bits look like this:
const HISTORY: usize = 60;
const SAMPLE_INTERVAL: Duration = Duration::from_millis(250);

let hal = Hal::new();
let i2c = hal.i2c();
let mut tmp = Tmp108::new_with_a0_gnd(i2c);

let mut samples: VecDeque<f32> = VecDeque::with_capacity(HISTORY);
let mut next_sample = Instant::now();

loop {
    if Instant::now() >= next_sample {
        let t = tmp.temperature()?;
        if samples.len() == HISTORY {
            samples.pop_front();
        }
        samples.push_back(t);
        next_sample += SAMPLE_INTERVAL;
    }

    terminal.draw(|frame| draw(frame, &samples))?;
    // ...event handling: quit on 'q' or Esc
}
The draw function splits the screen vertically into a stats row and a sparkline:
fn draw(frame: &mut Frame<'_>, samples: &VecDeque<f32>) {
    let chunks = Layout::default()
        .direction(Direction::Vertical)
        .constraints([Constraint::Length(3), Constraint::Min(0)])
        .split(frame.area());

    frame.render_widget(stats(samples), chunks[0]);
    frame.render_widget(sparkline(samples), chunks[1]);
}
…and sparkline rescales the float window into the integer bars that ratatui::Sparkline wants, so even tiny drifts are visible:
fn sparkline(samples: &VecDeque<f32>) -> Sparkline<'_> {
    let bars: Vec<u64> = if samples.is_empty() {
        Vec::new()
    } else {
        let min = samples.iter().copied().fold(f32::INFINITY, f32::min);
        let max = samples.iter().copied().fold(f32::NEG_INFINITY, f32::max);
        let span = (max - min).max(0.1);
        samples
            .iter()
            .map(|t| (((t - min) / span) * 1000.0).round() as u64)
            .collect()
    };

    Sparkline::default()
        .data(bars)
        .max(1000)
        .style(Style::default().fg(Color::Yellow))
        .block(Block::bordered().title(" last 60 samples  (q to quit) "))
}
That’s it. Read in a loop, push into a ring buffer, redraw. The total code is shorter than the LCD-init sequence I’d have written the first time I tried to do this on an MCU. And because it’s a normal terminal program, Ctrl-C cleans up and exits.
Once you’re in this world, a lot of other things become “just write the program”:
Data logging. A few lines of serde + csv and every sample gets a wall-clock timestamp on disk. Post-process with whatever you like — polars, pandas, jq, a quick shell pipeline:
let mut wtr = csv::Writer::from_path("temps.csv")?;
wtr.write_record(["timestamp_ms", "temperature_c"])?;
// inside the loop:
wtr.write_record(&[
    chrono::Utc::now().timestamp_millis().to_string(),
    format!("{t:.4}"),
])?;
Bus tracing. Wrap the driver in a tracing span and you get structured records of every transaction, every reading, every error, with timestamps and process metadata. Pipe it into tracing-subscriber, tokio-console, OpenTelemetry — pick your poison.
Stress testing. Spin up a tokio runtime, share the bus through a Mutex<Bus>, and have a dozen tasks all reading and configuring the chip concurrently. See what falls over. This is something you could do on the MCU, but it’s the kind of thing you’d never set up just to find out.
A/B testing. Run two versions of the driver against the same chip back-to-back, diff their outputs sample-for-sample. Catch a regression in the new version before it makes it anywhere near a production board.
Real CI. This is the one I’m most excited about. cargo test runs on a CI runner that has a Pico de Gallo plugged into it, with real chips wired up. Every PR exercises the driver against real silicon. No simulation. No “we’ll catch it in hardware testing later.” (More on CI in the testing chapter of the book.)
Runnable examples in your crate. This one flips the framing. So far we’ve talked about Pico de Gallo as something consumers of a driver crate use. But it works just as well for the author of the crate. Cargo lets you put a examples/ folder in your library and have each file be a binary; if those binaries can target a real, running version of your chip without anyone reaching for a soldering iron, they stop being “snippets you’d have to port to your board” and start being “things a reader can cargo run after plugging in two cables.”
The tmp108 crate’s examples are exactly this. There are five of them — one-shot read, continuous read, comparator-mode ALERT, interrupt-mode ALERT, and a embedded-sensors-hal trait demo — and every single one starts with let hal = Hal::new(); let i2c = hal.i2c(); (the ALERT ones also grab a GPIO for the interrupt line). A reader who wants to understand any of the modes runs cargo run --example oneshot and gets a real temperature back from a real chip. No board-bringup chapter. No “you’ll need to adapt this for your target.” The documentation is the running program.
Each of these was technically possible before. Each one required setting up its own bespoke pipeline, often with a custom MCU build, a custom log format, and a custom analysis layer on top. With a real bus available to a real std program, they all collapse into “use the crate that already exists.”
The catch
One might ask, what’s the catch? Here is the honest list.
USB latency. Every transaction is a USB round-trip. In practice that’s about a millisecond. For polling a temperature sensor every 250 ms, that’s invisible. For a tight register-poll loop at 100 kHz trying to catch a hardware event in software — no, that does not work, and pretending it does would be a lie. Use the chip’s ALERT pin and an interrupt-driven path for that, which Pico de Gallo also supports via the GPIO Wait impl.
Timing is host-mediated. You cannot reproduce sub-millisecond interrupt-to-handler timing on a host. You can validate the protocol your interrupt handler implements, but not the latency of getting to the handler. For that you eventually need the real MCU.
Single master, single bus. The Pico de Gallo is the only master on the bus. You can’t reproduce a scenario where two different MCUs are arbitrating for the same wires.
The driver still has to be no_std. Pico de Gallo lets you exercise the logic of the driver in a comfortable environment. It does not validate that the driver compiles for your real target. You still need a one-line “build for thumbv8m.main-none-eabihf” step in CI to catch accidentally pulling in std. The tmp108 crate has exactly that job running on every push for this reason.
None of these are surprises. They’re the natural consequence of moving the dev environment off the target. The point is that for the work that is portable — and a sensor driver is essentially all portable work — you don’t have to pay the cost of the target during development.
Wrapping up
A device driver is protocol logic. Protocol logic doesn’t care what CPU is initiating the transactions. So write it where iteration is cheap, where you have a debugger and a test runner and a profiler, where you can wrap it in any visualization or analysis tool you want, and where adding “log every sample to a CSV” is two lines of code instead of two weeks of integration work.
Pico de Gallo is one way to do that. It happens to be the one I built, because nothing else existed that gave me exactly this. If you want to read more, the book covers the hardware, the firmware, the wire protocol, and a full chapter on writing a driver from scratch against a different temperature chip (TMP102). The tmp108 crate used in this post is on crates.io, and its examples/ directory is full of cargo run --example-able programs that all target a real chip through Pico de Gallo. The full ratatui dashboard code lives in a tiny standalone project that you can copy and adapt.
If you build something with it — a driver, a logger, a CI rig, a dashboard for a chip you’ve been wanting to characterize — I’d love to hear about it.